Waiting to Get Your Dissertation Accepted?


Multiple linear regression is a powerful tool. It can be used in dissertations and theses when our goal is to:
- identify the factors that influence an outcome,
- predict an outcome based on a set of factors, or
- assess the sensitivity of an outcome to various factors.
Here’s the issue: Regression analysis requires a bit more work than simply identifying some potential predictors and making one run of the analysis using a software tool such as SPSS. There is more to it than that. Yet, far too often, we see a well-meaning but far too incomplete stab at it.
So, in this article, I want to cover some of the philosophy that drives a more complete and involved analysis using regression, and the steps you must include in a rigorous use of the technique. I want to emphasize that what I am saying here can be applied to any multi-variable analysis, including analysis of variance (ANOVA), binary logistic regression, and nonlinear regression.
Philosophy Behind Multiple Linear Regression

The real world is complex, right? Nothing surprising about that. But, what I mean by this mathematically is, what causes something to occur, or what influences the magnitude of something that occurs, is normally not simple.
Think about any human or scientific phenomenon that we would care enough about to study in a serious analysis, like a dissertation. I recently supervised a dissertation studying the factors that contribute to the likelihood of, the spread of, and the magnitude of a West Nile Virus outbreak. Pretty timely study, but also relatively complex. Lots of significant predictors, and lots of interactions between the factors.
Doing multiple regression right ensures that we address the complexities, nuances, subtleties, interdependencies, and counterintuition involved in the predictability, and sometimes causality, of challenging real-world phenomena. There are always surprises—proper regression helps to find them! Poorly planned and executed regression overlooks them.
What We’ll Talk About
I do not intend to talk about all of the details for executing multiple linear regression or other similar techniques. Instead, I want to cover a couple of components of a proper analysis that are often overlooked or insufficiently addressed.
The Key (and Not Always Emphasized) Components

Without a huge amount of detail, here are the most important, but least understood and often overlooked components of proper multiple regression.
Back to Philosophical Basis: Model-building
People often want to know if a factor is influential or predictive of some real-world phenomenon—or, what factors are. These are good questions, but they are incomplete questions met with insufficient answers.
The world is complex, so the influence that a single factor has on an outcome depends! It depends on the presence of other factors, and they tend to interact, often unpredictably. And sometimes, factors we are sure must be influential really are not; or they are related to another factor.
So, the right question is, what is the best combination of predictors of an outcome? For that reason, the right process is NOT to perform a run of regression analysis and declare which factors are significant; but, instead, to perform a thorough regression model-building analysis to find the best predictive mathematical model of the outcome. And, the factors that comprise that model are, then, by definition, the best predictors of that outcome.
More Than One Regression Tool
Because the prediction of an outcome is complex, we must guard against the attractiveness of and reliance on automated stepwise regression techniques (e.g., backward stepwise regression) as the sole source of answers to the question about the predictability or influence of factors.
Automated stepwise techniques are useful in providing a first glance at a predictive model. But, the result (the final predictive model of individual factors) is often dependent on the order that variables are excluded or included, and may not always be the best predictive model.
For that reason, you should use a combination of best-subsets regression, statistical regression (automated stepwise), and purposeful sequential regression (manual stepwise to evaluate various combinations of factors, some trial and error, to find the best model).
The evidence from all of these, together, should inform the choice of a predictive model and the predictors. It is never acceptable to execute one run of regression or one automated stepwise run, and then declare which factors are significant.
Statistical Assumptions

Proper regression, like any statistical technique, relies on several assumptions that must be tested for the technique to be valid. These include but are not limited to:
- A linear relationship between the predictors and the outcome
- No autocorrelation in observations
- Homoscedasticity
- No multicollinearity
- Normally distributed residuals
- No significant outliers
Lots of technicalities here, but the message is, do not give assumptions short shrift.
Missing Variable Bias
In statistics we guard against two errors: false positives and false negatives. In regression, these mean including predictors in the model that are not truly influential (false positives); and failing to include significant predictors (false negatives).
The danger of false positives is creating a noisy, low-precision predictive model. The danger of false negatives is missing variable bias—the model may be precise but inaccurate. We should be more concerned with bias (accuracy) than with noise (precision). So, we guard against this by being somewhat liberal about the variable inclusion criterion—often using a level of significance of .20 rather than the conventional .05 (Heinze & Dunkler, 2017).
This strategy may result in some false predictors and some noise, but a more accurate prediction of the outcome. We still test the overall model significance using an F test and a level of significance of .05 or less. But, our criterion for including predictors in the model is more liberal.
Regression Sample Size

We often rely on commercial tools such as G*Power (Faul et al., 2009) to perform sample size calculations. But, many do not know which tests to use, or which effect sizes. So, here is the best guidance I can provide in a short space.
Most problems we study through observation or surveys (not experiments), involve random (not fixed) variables. So, in G*Power, use the exact test, linear multiple regression—random model; one-tailed test; an appropriate effect size from Cohen (1988)—small (ρ2 = .02), medium (ρ2 = .13), large (ρ2 = .26); level of significance of no more than .05; statistical power of at least .95; and a proper count of predictors. Far too often, people use the wrong test and get an incorrect answer for minimum required sample size.
Two-Factor Interactions
I will write another article on this topic, as it is hugely important, challenging to understand, and often misunderstood. But, here is where some of the most significant insights will come from your regression analyses, and where some of the most important mistakes can be made when declaring the predictability of factors.
Simply put, a two-factor interaction exists when the relationship between a predictor and an outcome (its slope) changes based on the value of another predictor. Check out this figure.
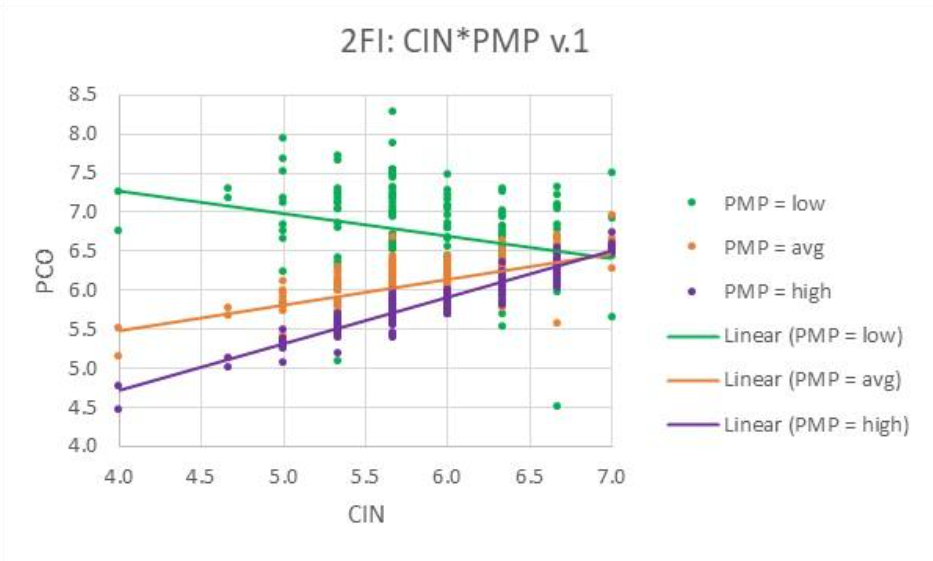
In this analysis found in a dissertation, CIN was found to be a significant predictor of PCO with a negative coefficient (slope). But, does PCO decrease with increases in CIN (negative slope) or does it increase? Well, it depends!
It depends on the value of another predictor, PMP. When PMP is low, PCO and CIN are negatively correlated; but, when PMP is high or average, PCO and CIN are positively correlated. Whoa! Can this be? Yes, it happens in many analyses and real-world situations. So we cannot say that CIN is a significant predictor, or that it is negatively or positively related to the outcome, without qualifying our assertation. And, we do that using a two-factor interaction.
We cannot live without two-factor interactions! But, take a look at 100 quantitative dissertations involving regression and see how many have even tested for two-factor interactions.
Final Thoughts
You wouldn’t think of building a house without considering more than simply the square footage and number of rooms. You wouldn’t make steel without considering the interaction between heat and composition. You wouldn’t take a digital photograph you intend to sell without a solid understanding of color, lighting, depth of field, motion, and composition.
And, you ought not to undertake a regression analysis of a complex and important real-world phenomenon without understanding the complexity of interacting variables, without following the rules about statistical assumptions, without adequate sampling, and so on.
Hopefully, this short article will help you know what you should be doing to perform regression right!
References
Cohen, J. (1988). Statistical power analysis for the behavioral sciences. Hillsdale, New Jersey: Lawrence Erlbaum Associates.
Faul, F., Erdfelder, E., Buchner, A., & Lang, A. G. (2009). Statistical power analyses using G*Power 3.1: Tests for correlation and regression analyses. Behavior Research Methods, 41, 1149-1160.
Heinze, G. & Dunkler, D. (2017). Five myths about variable selection. Transplant International, 30, 6-10.