Waiting to Get Your Dissertation Accepted?


One of the most confusing things about statistics is the lack of a common vernacular of terms and definitions related to variables. The taxonomy of variables is complex and inconsistently applied throughout academia and the public and private sectors. Terms are often used interchangeably, with great confusion.
Nevertheless, there are meaningful distinctions in terms and definitions. When violated or inconsistently applied, we’re headed for trouble. We’re likely to confuse readers and confound reviewers.
The purpose of this article is to explain the terminology, establish a common vernacular, and provide consistency regarding their use in analysis performed for theses and dissertations, and in real-world problems.
Bird’s Eye View
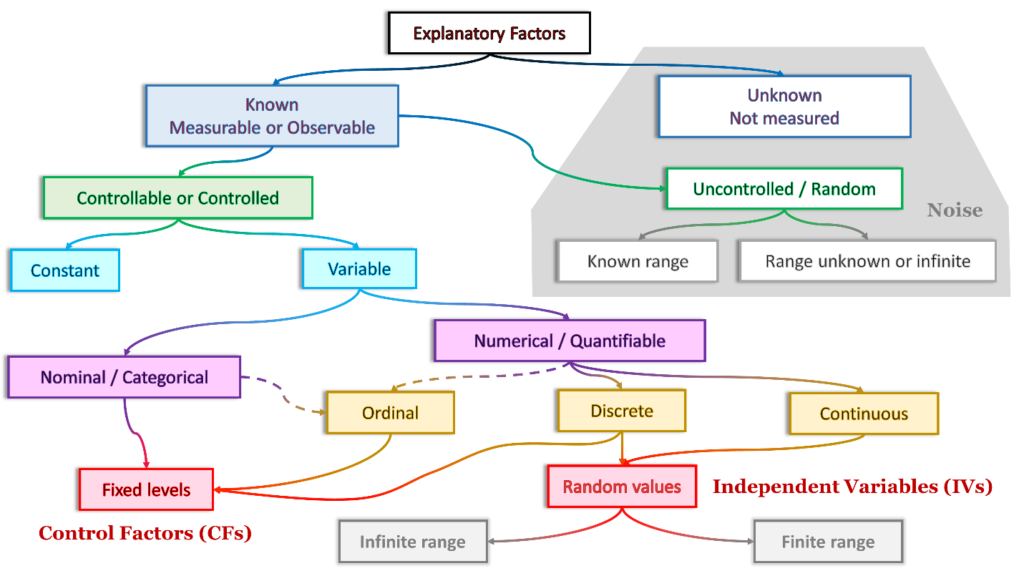
Let’s start with the big picture. I’ll refer to this schematic as we proceed through the first part of the discussion. These terms are a consolidation and adaptation from many sources, and my experience using them in a variety of analytical domains.
Why Do We Analyze?
When studying, quantitatively, the behavior of real-world systems or phenomena, the objective is to make inferences about the population, usually from a sample. We’re either trying to compare performance between groups or against a standard; or, simply trying to learn something about the population.
We obtain performance or behavior data from either direct observation, experimentation, testing, surveys, or third-party data.
Dependent or Response Variables
So, one of the first tasks is to decide what specific attribute we want to evaluate, and what is the measure of that attribute. That drives the data collection instrument.
In quantitative analysis, behavior or performance is assessed with some numerical measure, count, or scale—commonly referred to as either the dependent variable (DV) or the response variable (RV).
This is a numerical variable, either discrete or continuous. We’ll talk about those concepts later.
The DV or RV indicates an output—the performance, behavior, or effectiveness of a system, process, or activity under examination; or, a model/simulation of that system.
For example, let’s say we are interested in academic performance in a mathematics course. We might use a test score as a measure of performance. Or, perhaps we are testing the hardness of concrete with various combinations of ingredients and curing times—we would use an experiment.
We might be assessing driver behavior, by counting the number of times drivers fail to stop at a stop sign or make lane changes without signaling. Or, we might use department of health data on recovery from an ailment in response to various treatments. Each of these is a performance metric and captured as a dependent or response variable.
This is an essential step, tightly linked to the purpose of our analysis.
The Conditions for an Analysis

Our focus in quantitative analysis is on understanding the system’s response, under known circumstances (ideally controlled conditions).
Why is this so? Two primary reasons:
- We may be trying to determine the causes of behavior or performance. Without controlling the conditions, it is difficult or impossible to identify, with any confidence, what those causes are.
- Instead of cause-and-effect, we may simply want to know, what conditions are associated with performance and behavior? What conditions seem to be correlated to performance or behavior? What conditions seem influential, or are good predictors (whether they are direct causes or not)?
Explanatory Factors
The conditions are characterized by a combination of explanatory factors (and their values or levels). Explanatory factors are the inputs to a process, a system, or an experiment. They may be direct causes, indirect influences, or simply correlated with system behavior. Examples include environmental conditions (air temperature and pressure), competing mathematics curricula, driving conditions, demographics, and so on.
We can classify explanatory factors in several ways.
Noise
In a perfect world, we would know and understand all of the factors that cause, influence, or are associated with the performance or behavior of a system. Unfortunately, that’s not the world in which we perform analysis.
Unknown Influences
Some explanatory factors in a situation or activity are unknown (neither measured nor directly observed).
In other words, we observe random variation in performance, but we cannot explain that variation or associate it with any specific explanatory factors. For example, we might see variations in the hardness of concrete, not associated with the factors such as ingredients or curing time. The variation is due to lurking factors we have not identified.
The cumulative effect of unknown factors can be observed and quantified.
Known but Unmeasured
Or, some causes of variation may be known. But, either they are not considered likely to influence behavior significantly, or they are not included within the scope of our study. For [hopefully] sound reasons, they are neither controlled nor measured. They are, essentially, random influences and unmeasured (individually). They are allowed to vary across their natural range. That range might be finite or infinite. Examples include air temperature, demographic factors, and time of day.
The unknown and unexplainable factors, along with the known but unmeasured factors, are considered collectively and referred to as noise.
Everything else, by definition, is known; then, controlled in some way, or uncontrolled but measured.
Get Your Dissertation Accepted On Your Next Submission

Known and Measured Factors

To emphasize, we conduct data collection and analysis, preferably, when the conditions are controlled. Or, in the alternative, uncontrolled but measured or observed.
In an experiment, we control the explanatory factors. In non-experimental data collection, we do not control the explanatory factors. But, we certainly try to measure them even if they’re not controlled.
Constants and Variables
The explanatory factors that are known can be classified in two ways. Either they are constant (value is held the same throughout an experiment). Or, they are variable (can assume multiple values or levels).
Variables can either be nominal or numerical.
Nominal Variables
Explanatory factors may be qualitative/nominal/categorical. They represent and assume non-numeric values and are not measured, counted, or ordered (for example, gender, race, yes or no, curriculum A or B, and so on).
Data from categorical variables represent a nominal scale. They classify data into distinct categories, groups, or attributes. These may be naturally occurring, in which no order is implied. No value is superior to, greater than, or lesser than another (for example, state of residence).
Numerical Variables
Explanatory factors or variables can be numerical/quantitative, having values that represent quantities. They are either discrete (number of passengers in a car) or continuous (temperature).
Discrete variables have numerical values that arise from a counting process, are expressed in whole numbers or integers, and have gaps between the values (for example, 1, 2, 3, . . . , 100).
Continuous variables arise from measuring or calculating such that the values can be any number within a continuum depending on how precise the calculations or measurements (for example, 15.26 seconds or 25,561.34 feet).
Some variables, like mortality or cure outcomes, are binary responses—the answer is either yes or no (1 or 0).
Scales
Numerical variables are further classified by scales.
Ordinal variables classify data into distinct categories in which ranking is implied. The values are arrayed on a continuum where order is important and relevant (for example, responses on a questionnaire using a Likert scale: certain, likely, neither likely nor unlikely, unlikely, impossible). The ordering implies which category is superior in some way, but not by how much.
Some discrete and continuous variables use an interval scale. This is an ordered scale in which the difference between measurements is a meaningful quantity but does not involve a true zero point (for example, time).
Or, they may use a ratio scale. This is an ordered scale in which the difference between measurements involves a true zero point (for example, speed). Both the differences and the ratios are meaningful.
The Nature of Analysis of Real Phenomena
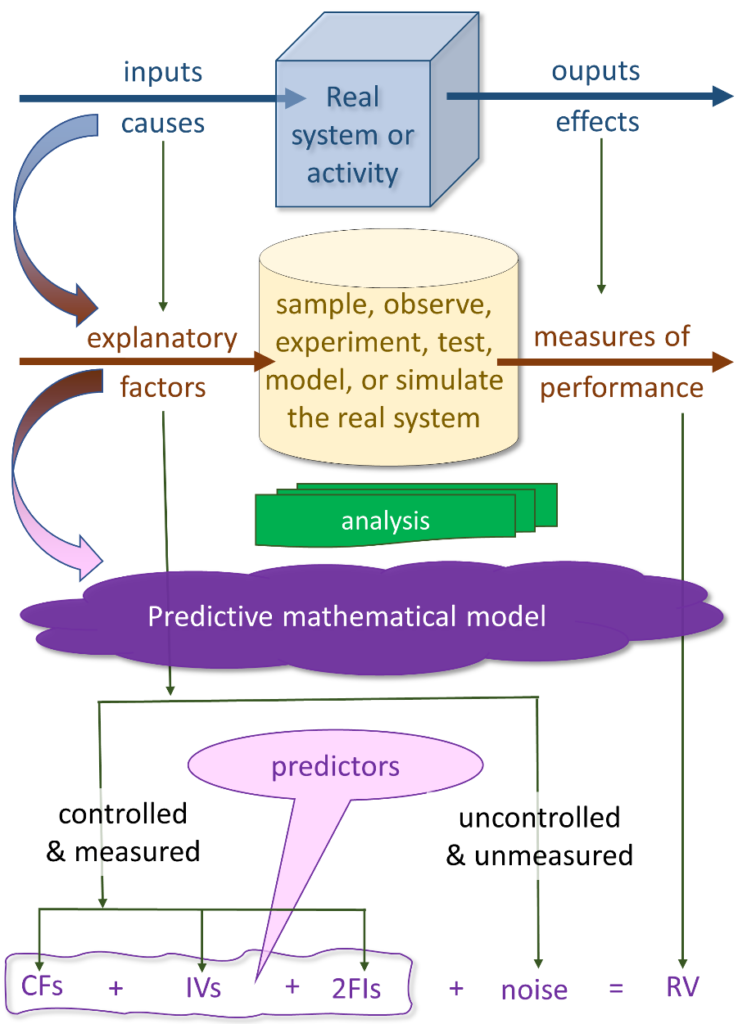
Now, let’s think about our research and analysis in terms of this illustration:
We are interested in a real-world phenomenon. It might be a physical, biological, or human activity—just about anything in our environment for which we have a reason to learn more, through research and analysis.
Systems Thinking
In systems thinking terms, these phenomena are systems, with inputs that are processed into outputs. The nature of the inputs is likely to determine or influence the nature of the outputs—in some way. The process could be anything that drives the system to behave.
Missing in this depiction is the classic feedback loop, which connects responses to changes or corrections in inputs. Let’s save that discussion for another article.
The outputs of the process, or system, are observable, measurable, or countable effects or responses. They occur as a consequence of the system behaving in its environment.
The inputs might be direct causes of system behavior. Or, they may be indirect influences. Or they might be conditions, circumstances, or attributes of the environment within which the system behaves.
Or, they may just be simultaneous—occurring at the same time, with no direct link yet discovered. But the output of the process seems to occur whenever or right after a specific input occurs.
Whatever the process is, the inputs are linked to outputs. And, we often wish to know how, in what ways, this link occurs. It forms the basis of lots of real-world, practical, and academic research.
Much of our quantitative research and analysis is intended to understand the link between the inputs and the outputs/effects.
Research and Analysis of Real Systems

When we decide to investigate real systems, we observe, test, experiment with, or simulate (using a model) the phenomenon. We either examine every instance of the population of activities (a census), or we sample a subset of the population.
We measure performance of the system. And, ideally, we exert some control over the conditions (as we said earlier, these are the explanatory factors).
Sometimes, the inputs (explanatory factors) are simplistic. If we are comparing the mean test scores with two groups, the input that we control is how we define and assign members of the groups.
For more complex systems and analyses, there may be a large number of potentially influential factors. Think about human behavior in a given situation, and how many possible conditions and factors might be influential.
Analysis
After collecting data, we perform whatever analysis is needed to answer the research question. It might be as simple as descriptive statistics (mean, standard deviation). Or it might be some relatively simple comparisons between groups, or between a group and a specification. We use statistical tests (for example, t tests) to assess hypotheses and infer knowledge about the population from our sample.
In more complex analysis, we might be interested in understanding which among a set of postulated explanatory factors is a significant predictor of the response. And, this might lead to exploration of cause-and-effect.
In this last category of analysis, we use various statistical tools (for example, Design of Experiments [DOE], regression, factorial ANOVA, and model-building) to develop predictive mathematical models (equations), which enable us to do these things:
- Determine which factors are significant predictors.
- Assess the sensitivity of the response to the predictors.
- Predict responses as a function of different values among the significant predictors.
Control Factors in Experiments and Math Models

We control the conditions (factors and variables) in experiments, tests, and some observations. Some of these are nominal, categorical, or ordinal. Their values may be fixed to a finite number of levels for an experiment. These are referred to as control factors (CFs) or simply, factors. Examples include demographics (gender and race), physical factors (ingredients in making concrete), days of the week, location, and so on.
In some cases, quantitative variables are held to specific, finite, discrete levels even though they are capable of assuming an infinite range of values. For example, for the purpose of the experiment, we might control the percentage of ingredients in concrete, temperature, and curing time, to a manageable number of specific values.
A quick note on the idea of control. . . . Sometimes, by control we mean actually, actively controlling the states, conditions, and factor values—this is a true experiment. Sometimes, by control, we mean ensuring we obtain data in which the states, conditions, and factor values are restricted. Sometimes we mean, controlling for the values of covariates which might be moderators of the influence of primary factors on the response.
To summarize, control factors are used as predictors in controlled, designed, factorial experiments analyzed using ANOVA.
For example, let’s say we are evaluating alternative curricula for teaching math in middle school. We might consider a controlled experiment, in which we measure math knowledge before and after a period of training. We might control gender, race, grade level, classroom, time of day of the tests, and (of course) which curriculum each student experiences. Another control factor is time—whether the test is the pre-test or the post-test.

In relatively simple hypothesis tests of means of two or multiple groups, the control factor (sometimes called the independent variable), is group. This we see in t tests and ANOVA.
Independent Variables
Some numerical variables are not controlled (held to a finite number of levels). Instead, they are allowed to vary randomly across a range of values (or within a range of interest to the analyst). We call them independent variables (IVs). They vary because the data set or the observation yields what it yields—some random variance among the quantitative variables.
If allowed to vary without control, temperature, age, height, blood pressure, and body mass index would be independent variables.
Independent variables are used as predictors in other than factorial experiments. Here, we rely on various regression model-building techniques to find the significant IVs.
Note the distinction: control factors (constrained to a controlled set of values) versus independent variables (allowed to vary randomly across a range of values).
Factor Interactions

A two-factor interaction (2FI) is a numerical component in a predictive mathematical model. A 2FI indicates that the influence on the response variable by one predictor depends on the value of a second predictor. For example, the relationship (slope or coefficient) between X1 (age) and Y (test score) changes depending on the value of X2 (gender). Gender moderates the relationship between age and test scores.
Conclusions about the significance and magnitude of relationships between predictors and response variables must be tempered by a consideration of 2FIs. The quality and reliability of predictive models depends on the analysis and interpretation of 2FIs.
2FIs are computed as the product of each pair of predictors (for example, X1 × X2). 2FIs can be between independent variables, between control factors, or between independent variables and control factors. In our analyses, we (and apps such as SPSS do) convert categorical variables to numerical dummy variables so we can assess 2FIs.
Hierarchy of Variables
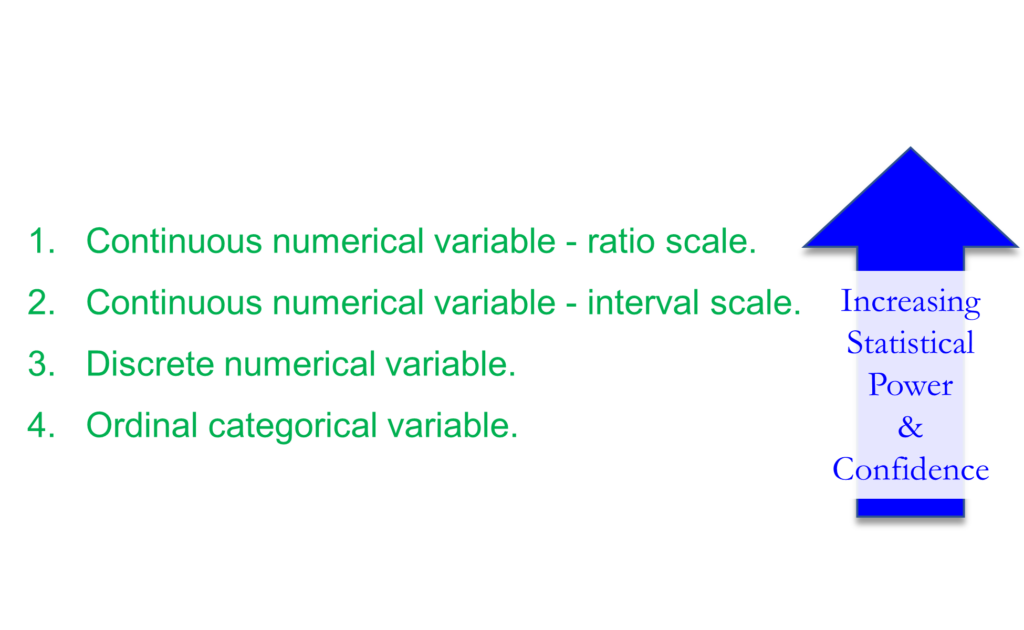
In quantitative analysis, there are ways of dealing with every form of numerical variable. However, the strength of an experiment, the validity of its outcomes, and the usefulness of the analysis, is directly affected by the form of the variables.
In fact, the strength of an analysis improves as we move through the following hierarchy of variables, from those yielding the lowest statistical power and confidence to the highest:
This is because (a) the higher the form of variable, the more information that is conveyed; and (b) the higher the form of variable the more precise the relationships between variables.
Control factors are categorical/nominal. By definition, they involve factorial experiments relying upon ANOVA for analysis and.
On the other hand, for response variables (all analyses) and independent variables (non-experimental with less control over the predictors), the preference is for continuous numerical variables.
Generally, analysts should never convert a variable to a lesser form (for example, converting a continuous numerical variable to a categorical variable)—except for a very specific reason and with strong rationale. Converting a numerical variable into a categorical one results in the loss of information, precision, power, and confidence.
Keep numerical variables numerical! Adjust the statistical tool to match the data, not the other way around.
Summary
There is a tendency to use mathematical terms loosely, which leads to confusion. There may be a bit of debate among scholarly sources about definitions, But, there is generally agreement among the experts. In any case, one sure way to confuse your readers and reviewers is to fall prey to inconsistency.
Final Thoughts
Because of the confusion in the taxonomy, the best advice I can give is this:
- Strive to understand the terms and their differences.
- Stick with terms and definitions that you can justify with scholarly sources.
- Define the terms up front.
- Be consistent throughout your document.
References
- Aczel, A. D., & Sounderpandian, J. (2006). Complete business statistics (6th ed.). McGraw-Hill/Irwin.
- Everitt, B. & Skondral, A. (2010). The Cambridge dictionary of statistics (4th ed.). Cambridge University Press & Assessment.
- IBM Corporation. (2022). IBM SPSS Statistics for Windows, Version 28.0. IBM Corp.
- Levine, D. M., Berenson, M. L., Krehbiel, T. C., & Stephan, D. F. (2011). Statistics for managers using MS Excel. Prentice Hall/Pearson.
- McAllister, B. (2023). Simulation-based performance assessment. Kindle.
- Nicolis, G. & Nicolis, C. (2009). Foundations of complex systems. European Review, 17(2), 237-248. https://doi.org/10.1017/S1062798709000738
- Northern Illinois University (NIU). (2022a). Responsible conduct in data management: Data analysis. https://ori.hhs.gov/education/products/n_illinois_u/datamanagement/datopic.html
- Northern Illinois University (NIU). (2022b). Responsible conduct in data management: Data collection. https://ori.hhs.gov/education/products/n_illinois_u/datamanagement/dctopic.html
- SAS. (2017). Statistical analysis. https://www.sas.com/en_us/solutions/analytics.html#statistical-analysis
- Snedecor, G. W. & Cochran, W. G. (1973). Statistical methods (6th ed.). The Iowa State University Press.Warner, R. M. (2013). Applied statistics: From bivariate through multivariate techniques. Sage.